01
TTM Squeeze Candles with Dynamic Strength Bar
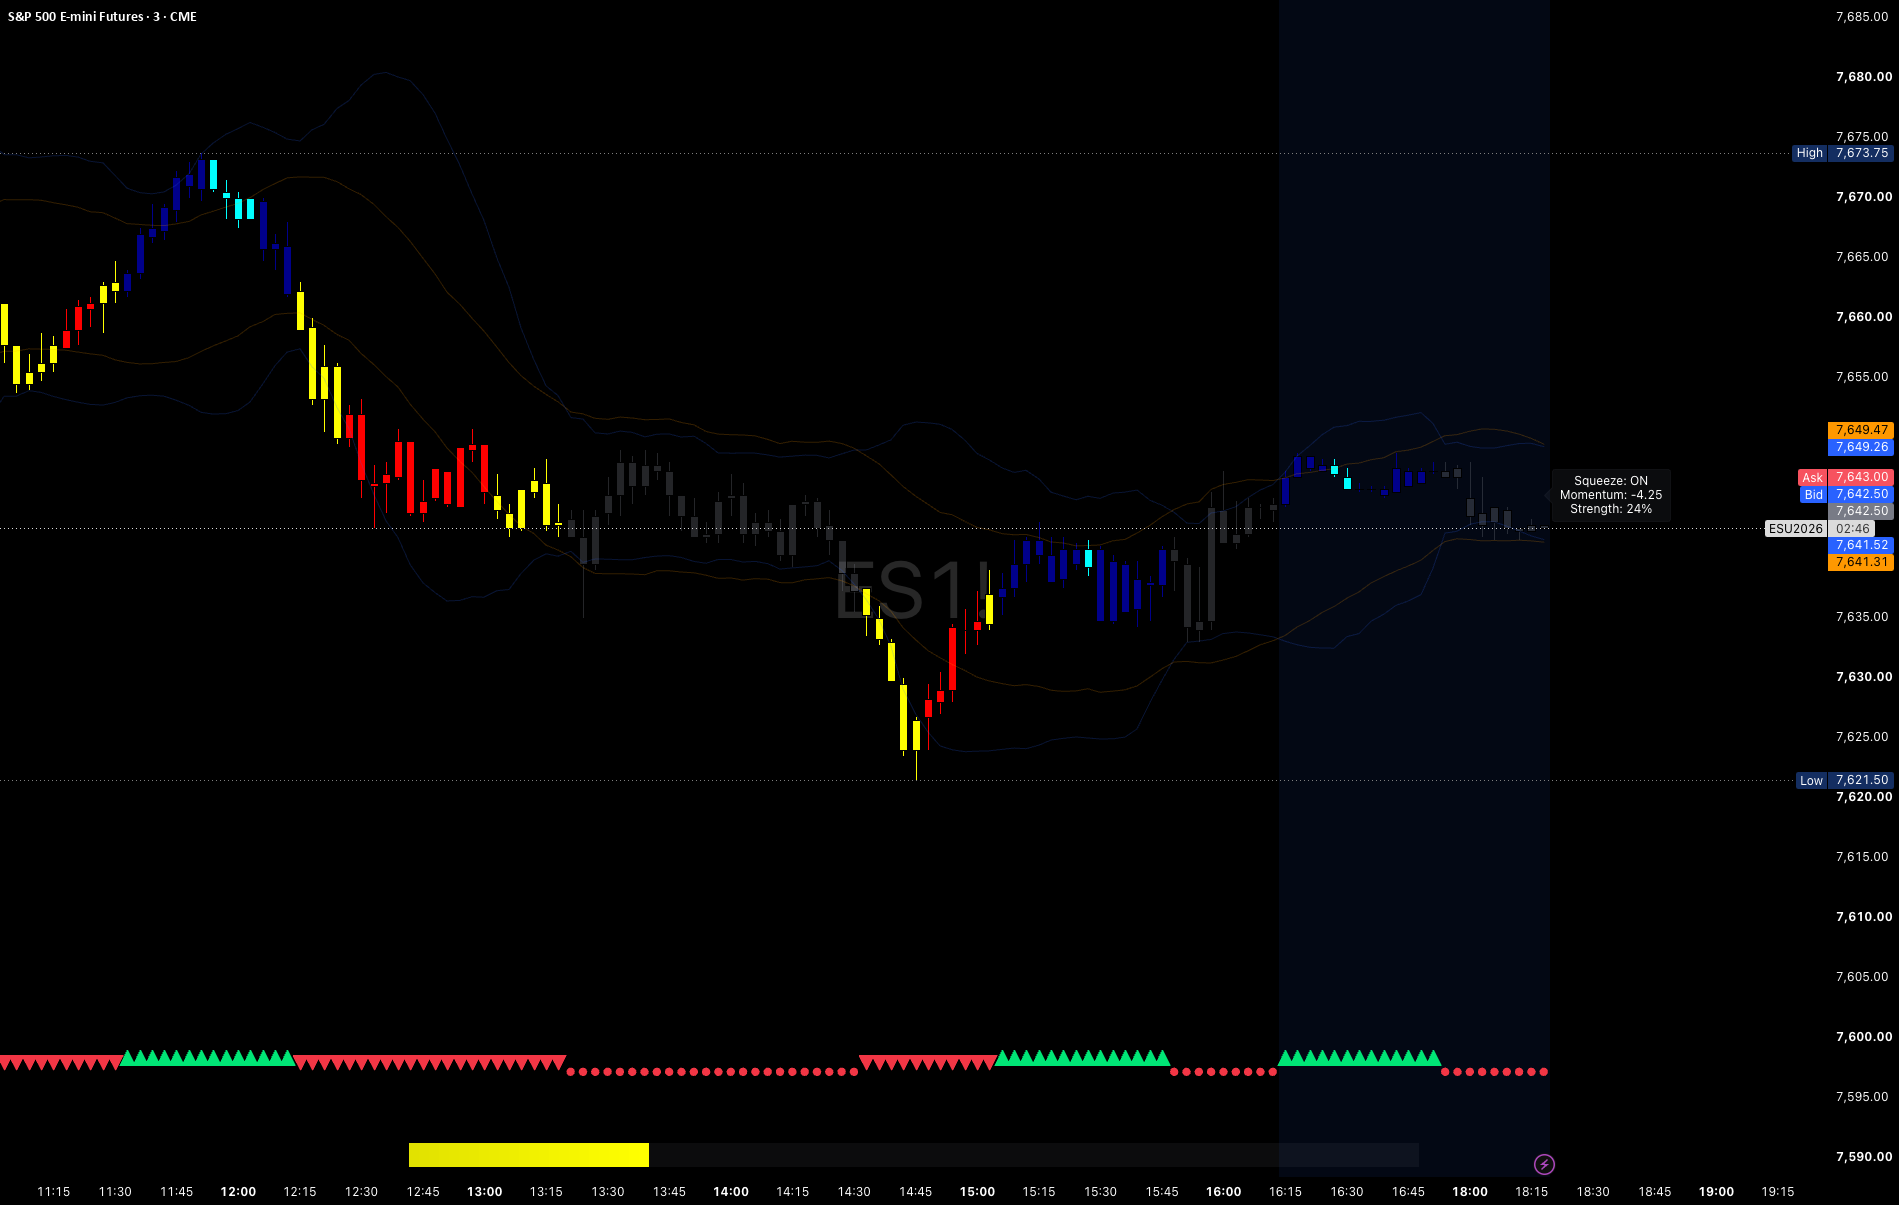
Tribute to JC. Squeeze candles. Use with TTM Squeeze to see when Bollinger Bands compress inside Keltner Channels — and when that energy releases into a larger-than-expected move.
Open on TradingViewSPX 7,726.3. OIL $93.38. DXY 97.15. VIX 20.00. BTC $84,386. ETH $2,686. SOL $121.80. XRP $1.5171
Free TradingView resources
Morpheus’s TradingView indicators, shared in Discord #resources (My Indicators). Each one lives on TradingView — open it there to add it to a chart.
01
Tribute to JC. Squeeze candles. Use with TTM Squeeze to see when Bollinger Bands compress inside Keltner Channels — and when that energy releases into a larger-than-expected move.
Open on TradingView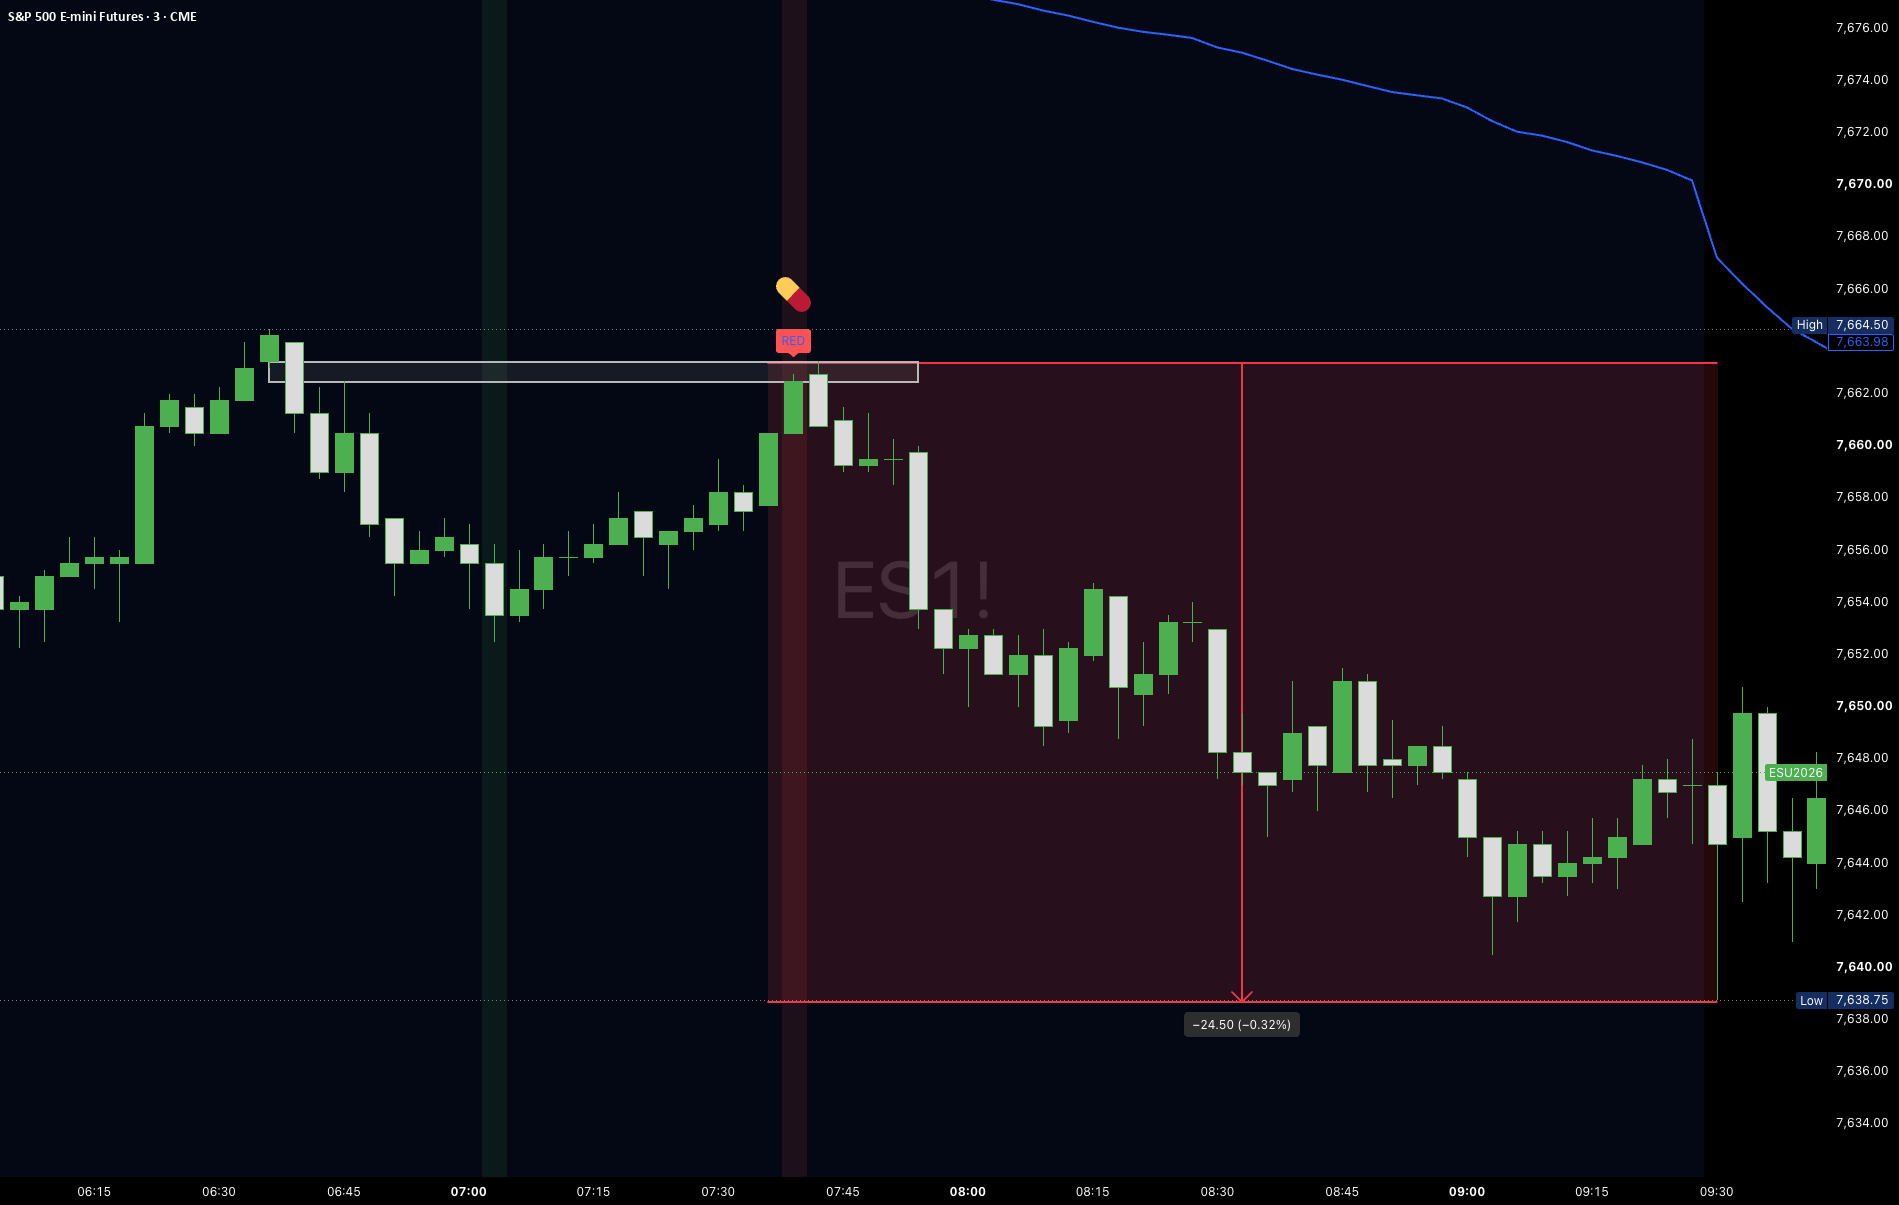
02
VWAP and RSI divergence as confluence, typically on a pullback into support or resistance inside an existing trend. Red Pill marks a potential short. Blue Pill marks a potential long.
Open on TradingView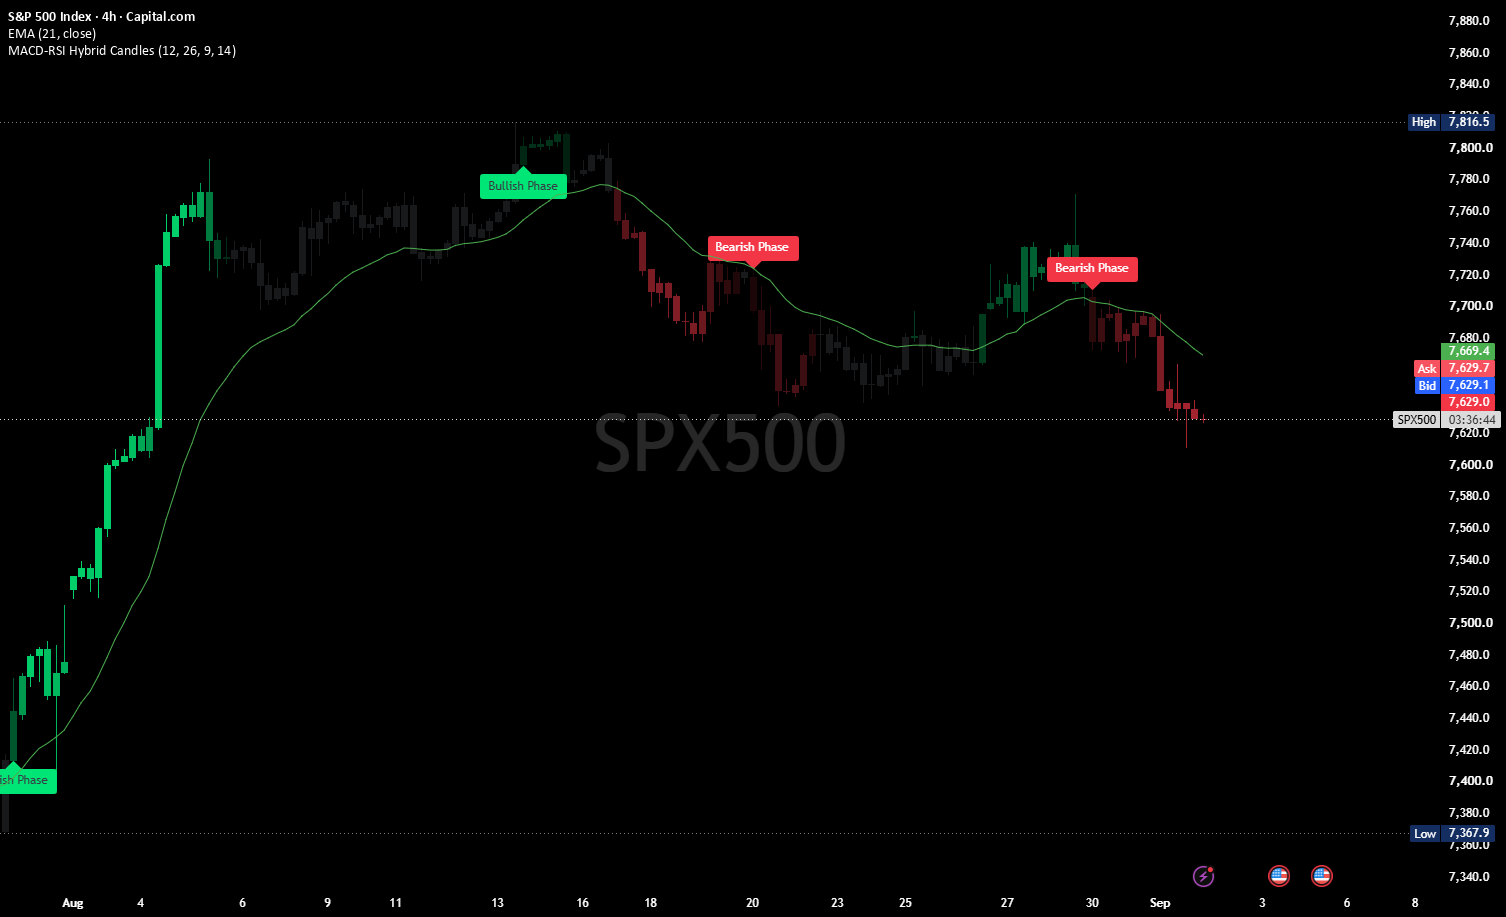
03
Candle color and intensity show MACD momentum. A cross up is the bullish phase. A cross down is the bearish phase. RSI is factored into intensity — a read on when to get in and when to get out, alongside your setup.
Open on TradingView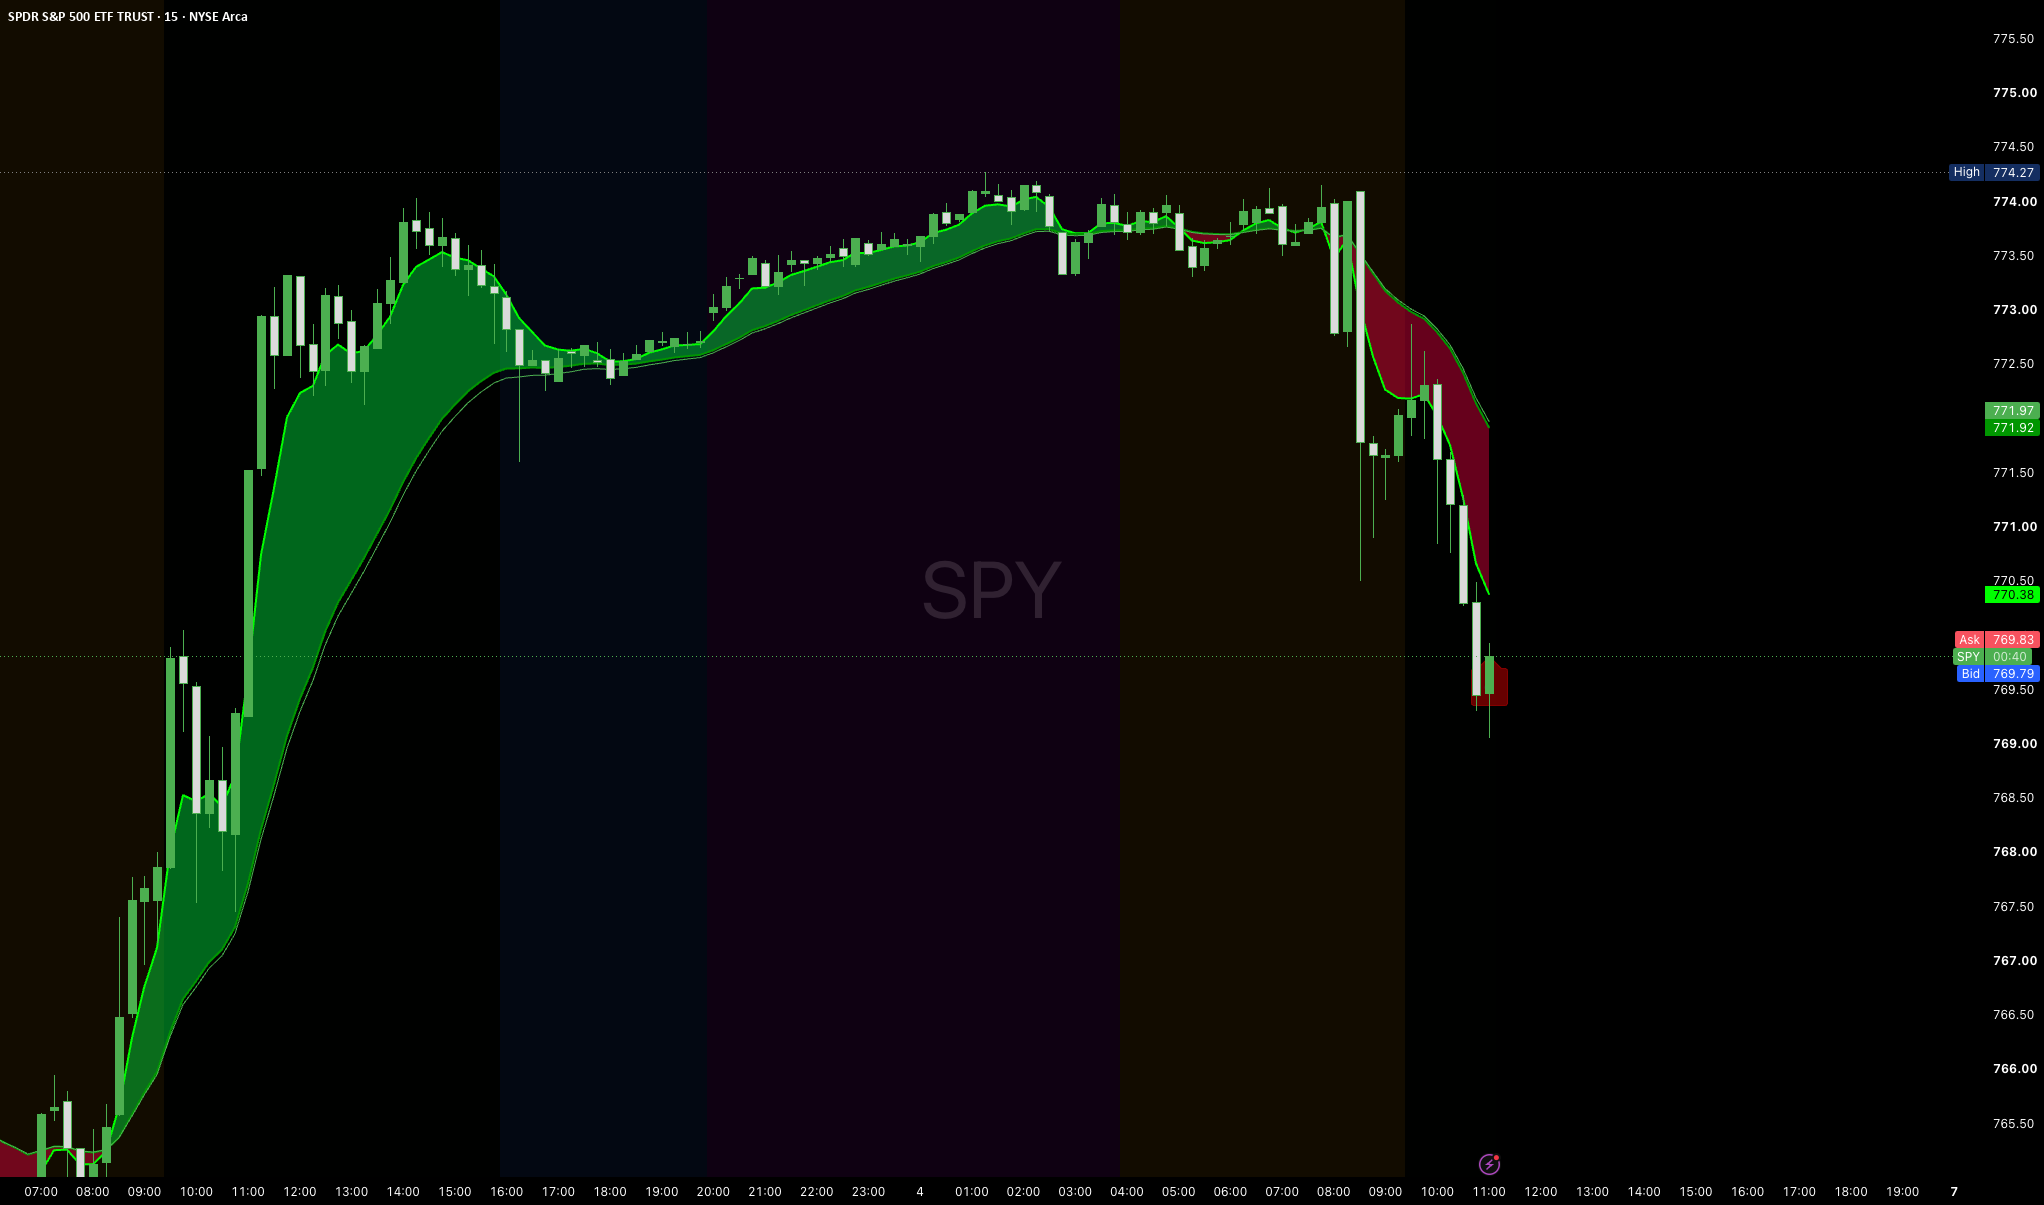
04
A two-EMA cloud. 9 EMA is Neo. 21 EMA is Trinity. Neo above Trinity is bullish. Trinity above Neo is bearish. A cross is a potential trend change.
Open on TradingViewShared in Discord #resources. Open the thread.